
Reports turn the walkthroughs your team has already finished into a document you can share with a principal, bring to a leadership meeting, or keep for your records.
Reports and Analytics are not the same thing
This is the part worth understanding first, because it explains when to use which.
- Analytics is the live view. It updates as new walkthroughs come in, and it is built for exploring, filtering and asking questions of your data right now.
- Reports are snapshots. A report is a PDF that captures what the data looked like on the day you created it, and it does not change afterwards.
So when you want to look around and dig into what is happening, use Analytics. When you want to hand someone a fixed document that will still say the same thing next month, create a report.
If it is the live view you are after rather than a report, start with Understand EW’s Advanced Analytics.
How to create a report
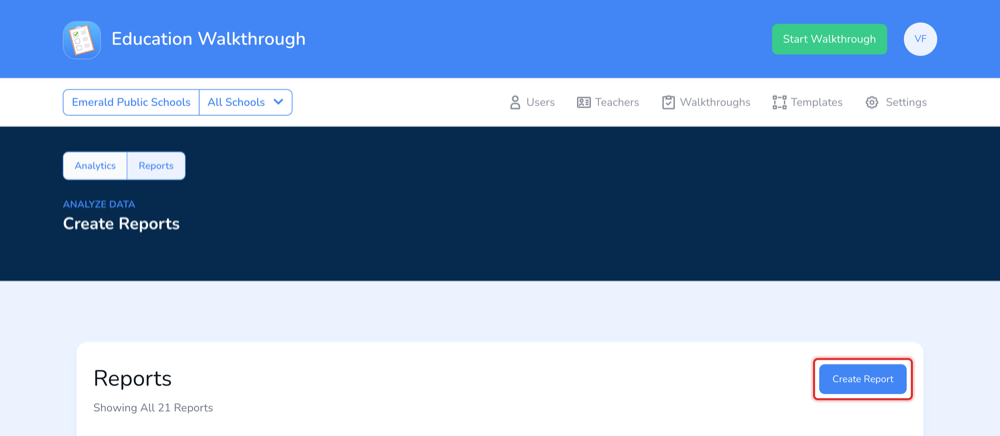
- Go to Walkthroughs, then Analyze Data.
- Open the Reports tab.
- Click Create Report.
The report categories
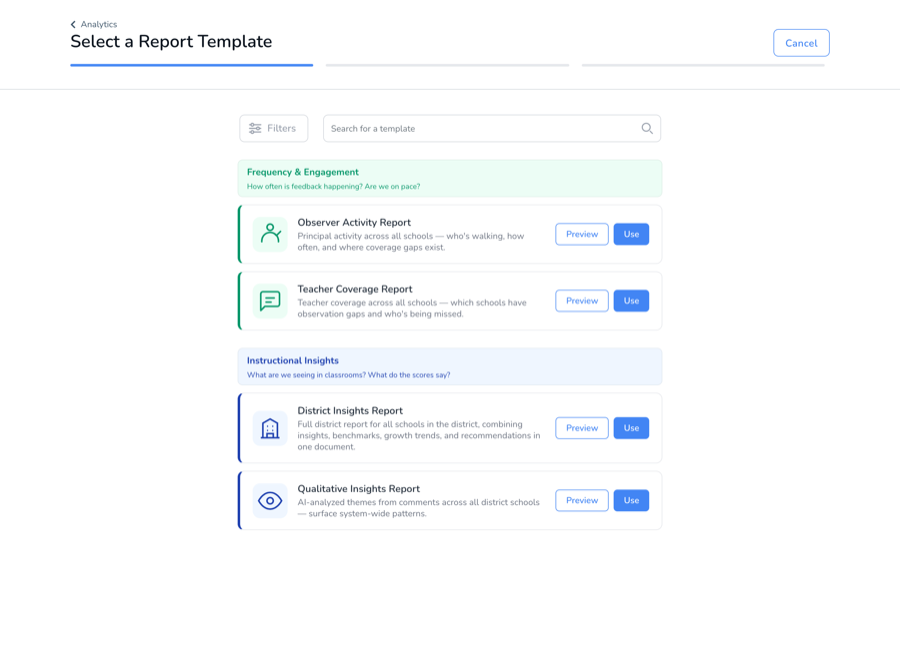
Reports are grouped by the question they answer, so you can start from what you are trying to find out rather than from a list of file names.
- Frequency and Engagement. How often is feedback happening, and are we on pace? Who is observing, how often, and where the coverage gaps are.
- Instructional Insights. What are we seeing in classrooms, and what do the scores say? Themes, narrative summaries, and score breakdowns from your walkthrough data.
- Performance and Benchmarking. How do we compare against peers, and who is leading? School against district average, schools ranked side by side, and observer consistency.
- Progress and Growth. Are teachers and schools improving over time? Growth trends by domain, checkpoint comparisons, and individual teacher growth profiles.
- Alerts and Accountability. What needs attention now, and are we meeting our commitments? Zero-observation alerts, declining trends, and coverage gaps surfaced for you.
- Strategic Planning. What should we do next, and how do we tell the story? Priority areas for professional development, and board-ready annual summaries.
- Accreditation and Compliance. Can we prove our instructional quality to accreditation bodies? Framework-mapped evidence, and whether a purchased curriculum is showing up in classrooms.
Each report has a Preview so you can see the shape of it before committing, and a Use button to start building.
What you see depends on your level
Reports are built for the scope you work at. A school administrator gets reports built around a single school, a district administrator gets reports that span the schools in the district, and region accounts get their own set. Many reports adapt to both, so a district view can be scoped down to a single school.
The categories above are the full picture of where reports live. Which reports appear inside them depends on your level and your plan, and we add new ones over time, so your list will grow and it may not match a colleague at a different level. If you are unsure what level your account sits at, see User Roles.
Choose your report data
The next step is where you tell the report what to cover. Every report asks for slightly different inputs, so this screen will not look the same for all of them, but you are generally choosing along four lines.
- Your tool. Which walkthrough template or rubric the report pulls from. Archived templates appear here too, under an Archived heading, so retiring a template does not lock away the data you collected under it.
- Your time period. Any date range, a coaching cycle, a quarter, or the full year. This is how you report on last year.
- Your teachers. One teacher, a group of teachers, or everyone.
- Your scope. A department, one school, or every school in the district.
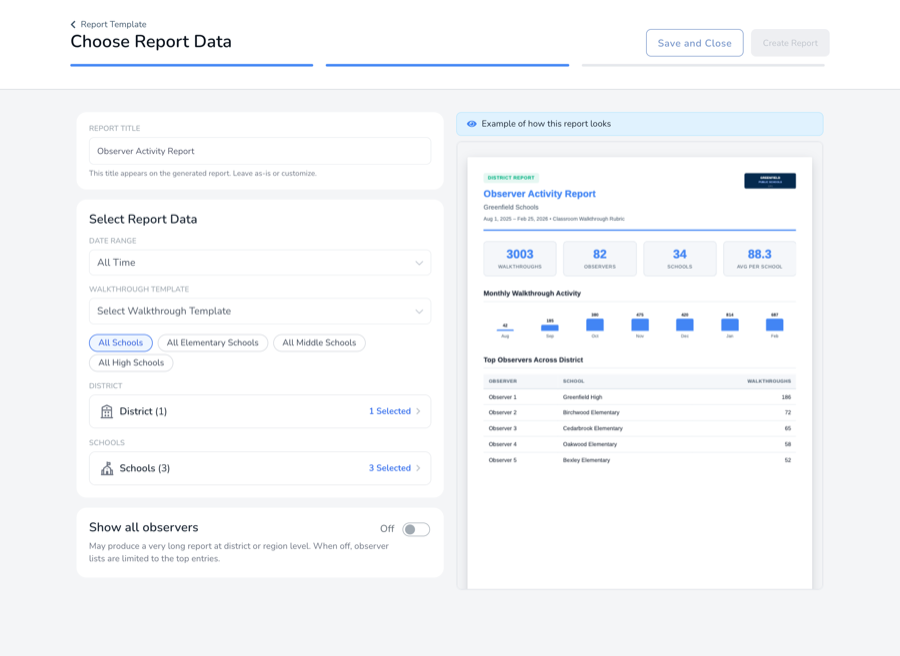
Treat that screen as an illustration rather than a checklist. Follow the prompts for the report you chose, then click Create Report, or Save and Close to come back to it later.
Who can see your report
Reports you create are private by default. Only you can view, edit and use them until you decide otherwise.
To change that, open the report’s visibility and choose Share, then pick who it goes to. What you can share with depends on your level, for example the schools in your district, or across your region. The Reports list has a Visibility column so you can tell at a glance which of your reports are private and which are shared.
Frequently asked questions
Is a report live, or is it frozen?
It is frozen. A report is a PDF snapshot of the data as it stood when you created it. If you want the live picture, use Analytics instead.
When should I use Analytics rather than a report?
Use Analytics to explore and ask questions while the data keeps updating. Create a report when you need a fixed document to share or keep.
Why does my colleague see different reports?
The report list follows your level and plan. School, district and region accounts each get a set built for their scope.
Can I report on a template we archived?
Yes. Archived templates appear in the walkthrough template picker under an Archived heading.
Can I run a report for one group of teachers?
Yes, use the group filter on the data step. See How to Create and Use Groups for how to set groups up.
Why is my report empty?
Usually the template and the date range do not overlap, so that template had no walkthroughs in that window. Widen the date range or choose a different template.
You do not have the report I need. Can you build it?
Quite possibly. Most of these reports came from conversations with instructional leaders we work with, so if one needs tweaking or you have an idea for another, open a support ticket.