
A leadership team meeting has about ninety seconds for each slide. “Student engagement was high in 58 percent of the classrooms we visited this month” lands faster as a pie chart than as a row of bars. The Results view in Analyze Data draws your walkthrough answers either way, one chart per question, and you switch between the two with one click.
Get to the Results view
- Open Walkthroughs and click Analyze Data. District users pick the school from the school dropdown first, or leave it on All Schools to see the whole district.
- Choose a Date Range. The available dates for the data you have are shown under the field.
- Choose a Template. The list shows how many walkthroughs each template has in that range.
- Click Submit.
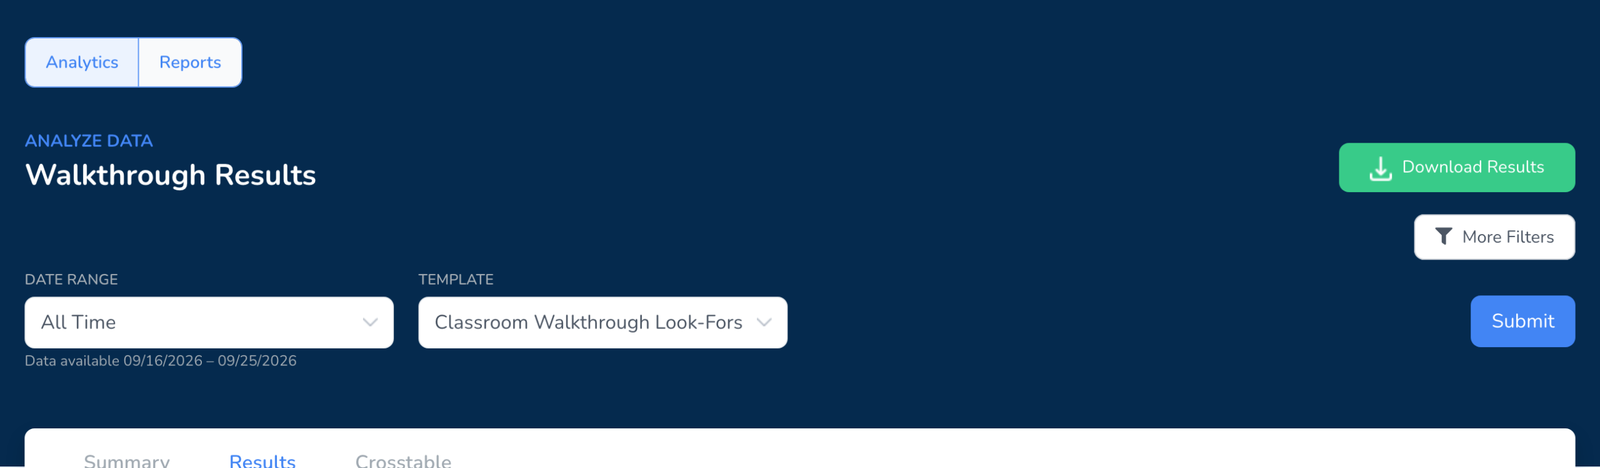
- Click the Results tab. Summary shows the headline numbers, Crosstable compares two questions against each other.
Switch between pie chart and bar graph
At the top right of the Results tab are two switches. Pie Chart and Bar Graph change how every question on the page is drawn. By Question and By Department change what each chart is counting.
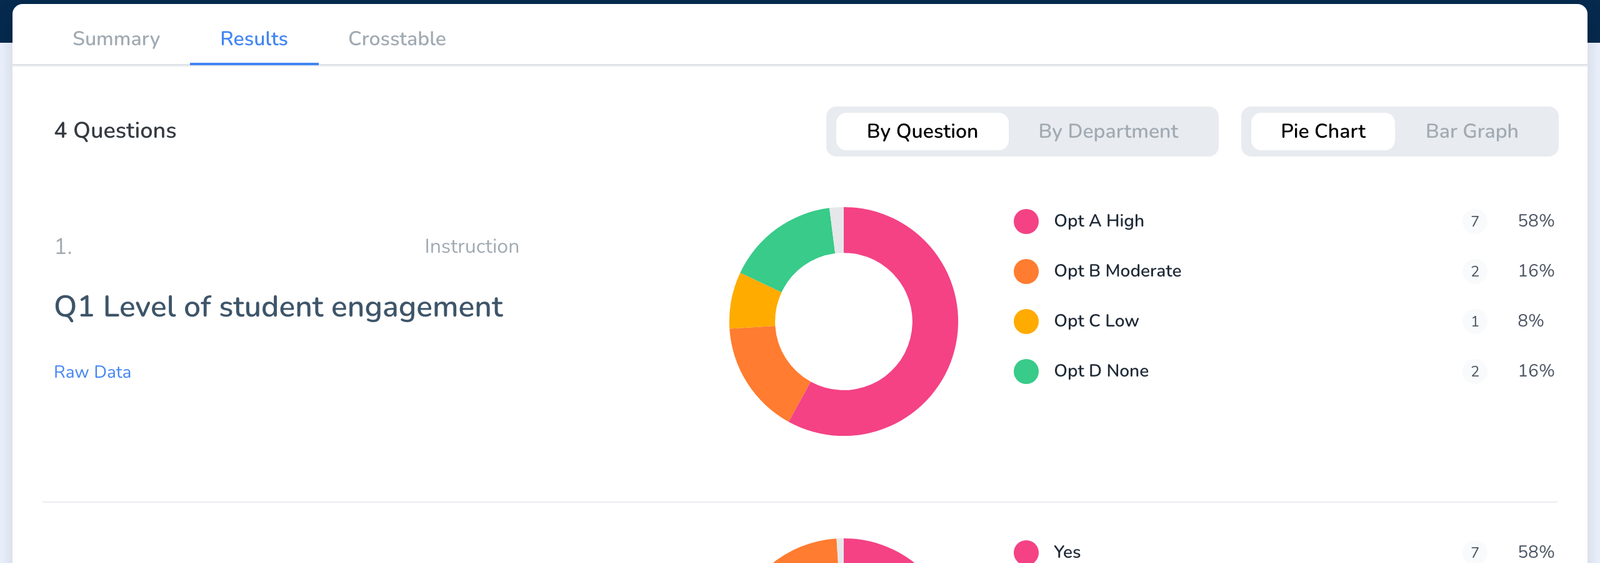
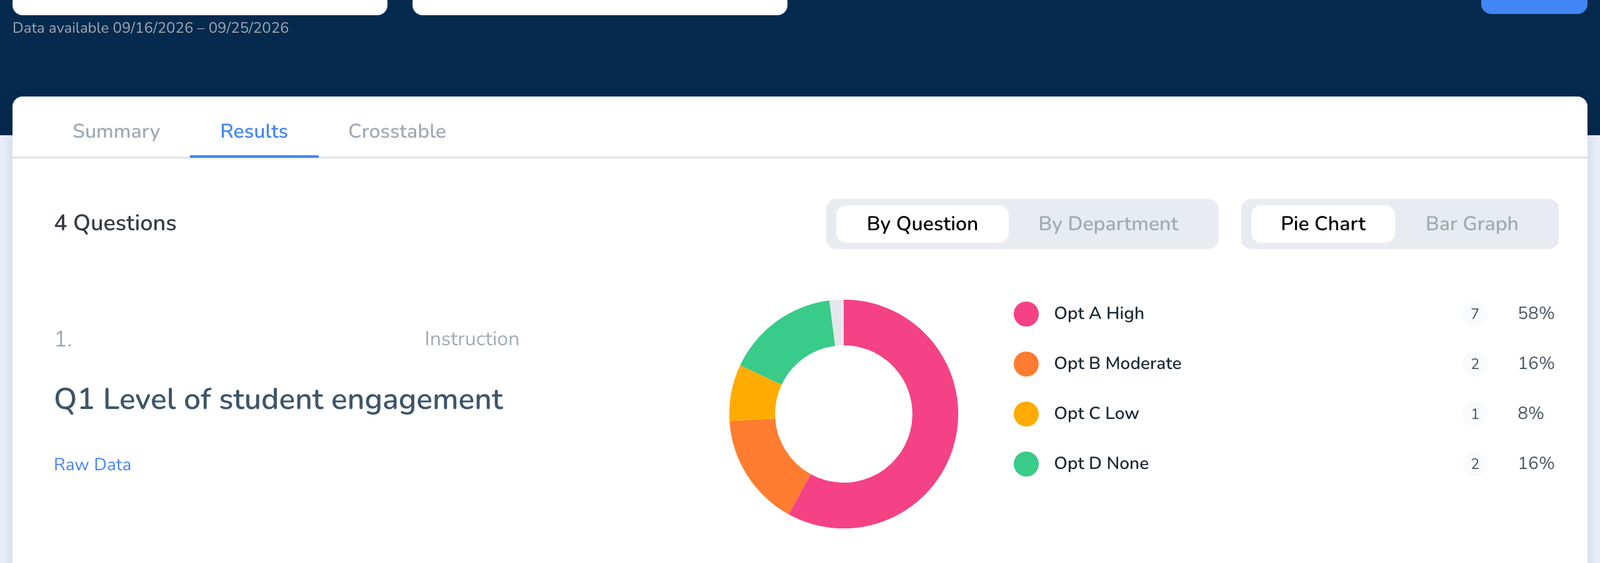
- Pie Chart works best for a question with a few options where the share matters, such as a level of engagement or a yes or no.
- Bar Graph works best for checkbox questions and anything with five or more options, where slices get too thin to compare.
- By Department breaks each question down by the department observed, so you can see whether a look-for shows up more in math than in English.
- Raw Data under any question lists the individual walkthroughs behind the chart.
Take it with you
Download Results at the top of the page exports what you are looking at. For a formatted, shareable document built from the same data, see How to Create a Report. For the full data set, see Export or Download Your Data to a CSV.
Frequently asked questions
Q: The chart toggle is missing.
A: You are on the Summary tab. The Pie Chart and Bar Graph switches are on the Results tab.
Q: Can I show one chart per teacher instead of per question?
A: Use More Filters to narrow the results to one teacher, or use the Individual Teacher Report, see How to Create a Report. Results charts are always drawn per question.
Q: Why do the percentages not add up to 100?
A: Checkbox questions let an observer pick more than one option, so the shares overlap. Yes or no and multiple choice questions always total 100.
Q: Can I compare two groups of teachers?
A: Yes. Put them in groups and filter by group under More Filters, see How to Create and Use Groups. The Crosstable tab compares two questions instead.
Q: Does the mobile app show these charts?
A: Analyze Data is a web dashboard view. The app is for conducting walkthroughs.